Deep dives
The Framework continuously investigates the relevance of its priorities and the credibility of its indicators and measures through regular materiality reviews and deep dives into specific priorities.
The SSG has completed deep dives into Balance of Tree and Grass Cover and Animal Husbandry Techniques.
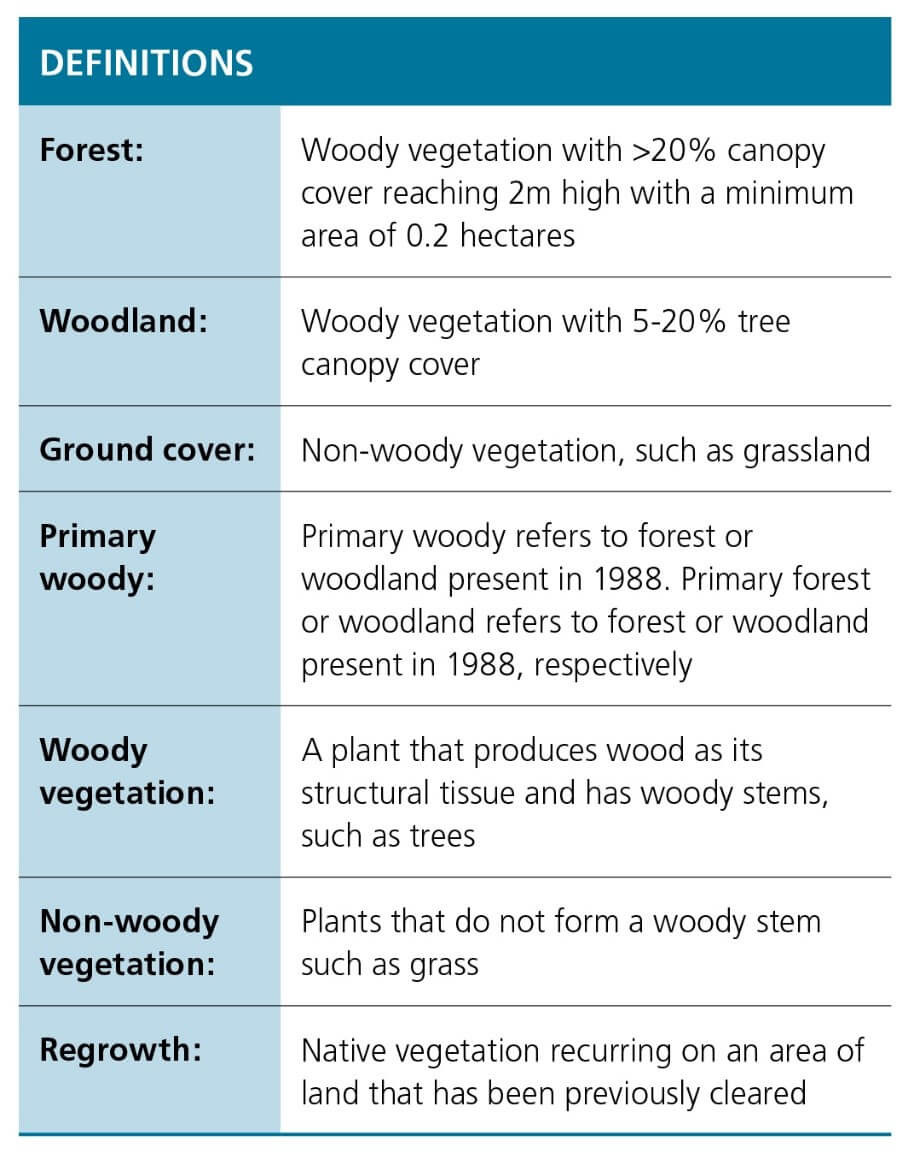
Balance of Tree and Grass Cover
Why it matters
Tree and grass cover impact both the environment and production. This vegetation is critical for storing carbon and preserving biodiversity and soil health. This plant life also plays a significant role in productivity, affecting profitability and the livelihood of people and communities in the industry.
The topic is complex and of increasing interest to stakeholders through the value chain. Landholders in Queensland are concerned laws would impact their ability to manage areas of regrowth and woody thickening which has negative consequences for production and, in many areas, also the environment.
The New York Declaration on Forests’ goal to halve global deforestation by 2020 has motivated public commitments from beef customers. McDonald’s, the largest single customer of Australian beef, has committed to eliminate deforestation from its beef supply chain by 2020. Fourteen of the industry’s largest global retail customers have also made a similar public commitment to eliminate deforestation from their supply chains as a member of the Consumer Goods Forum.
In response to our stakeholders, the ABSF has spent a year focusing on developing evidence-based and practical measures for the balance of tree and grass cover.
Getting experts' opinions
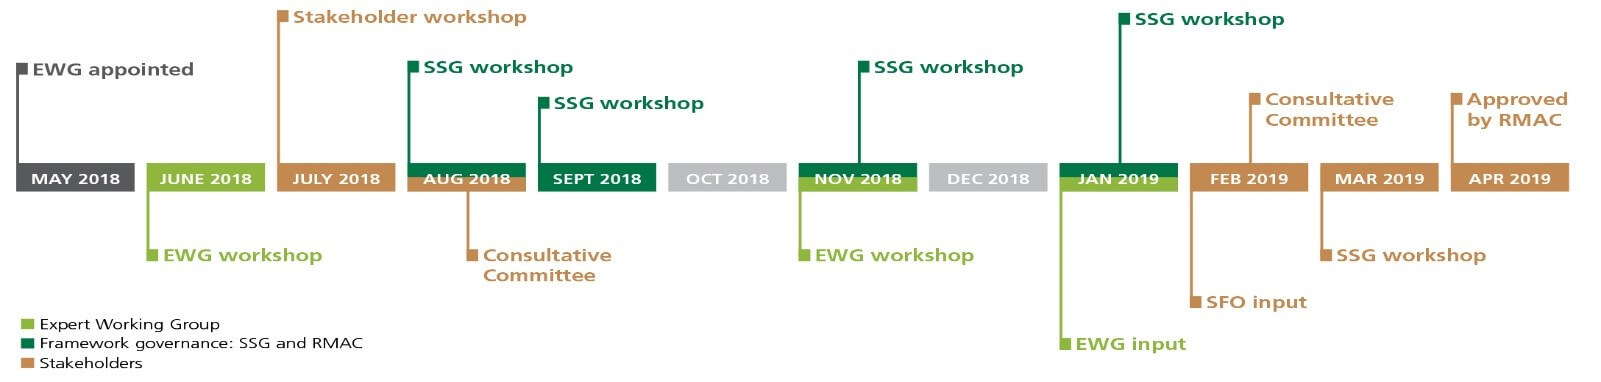
To help tackle this priority, the SSG convened the first multidisciplinary Expert Working Group (EWG) in June 2018 to review, refine and propose indicators for the balance of tree and grass cover.
The EWG included thought-leaders across the fields of ecology, remote sensing, biodiversity, conservation, animal productivity, and grasslands. These technical experts provided advice to the SSG on robust, credible and practical indicators and measures.
The experts provided diverse perspectives to the SSG from their different disciplines. Balancing these perspectives was one of the challenges in refining the indicators. Additionally, the vast regional differences in climate and ecosystems presents a challenge of how to develop national measures that are also regionally meaningful and able to be used to drive change on the ground in the coming years.
Principles for refining indicators
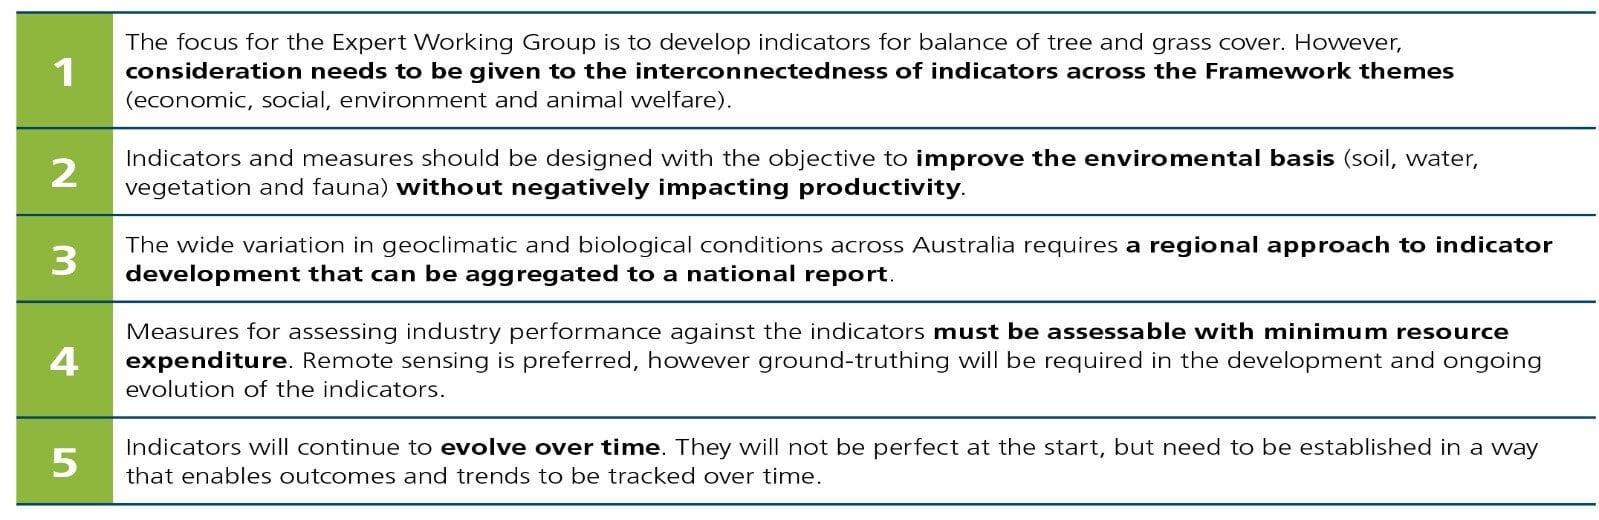
Developing the indicators and measures
The experts provided invaluable technical advice to the SSG on the balance of tree and grass cover. The SSG also sought perspectives from key stakeholders:
- Peak industry councils and state farming organisations
- Environmental groups and NGOs
- State environmental departments
- Industry and external stakeholders who are members of the Consultative Committee
Over multiple sessions, the EWG provided advice to the SSG. Based on this advice, the SSG developed indicators and measures which it tested with an array of stakeholders.
This collaborative and consultative process went on over the course of the year until there was reasonable satisfaction from the experts, stakeholders and the SSG. The final indicators and measures were decided in March 2019. As with the entire Framework the indicators will continue to be refined and improved as data collection and science advances.
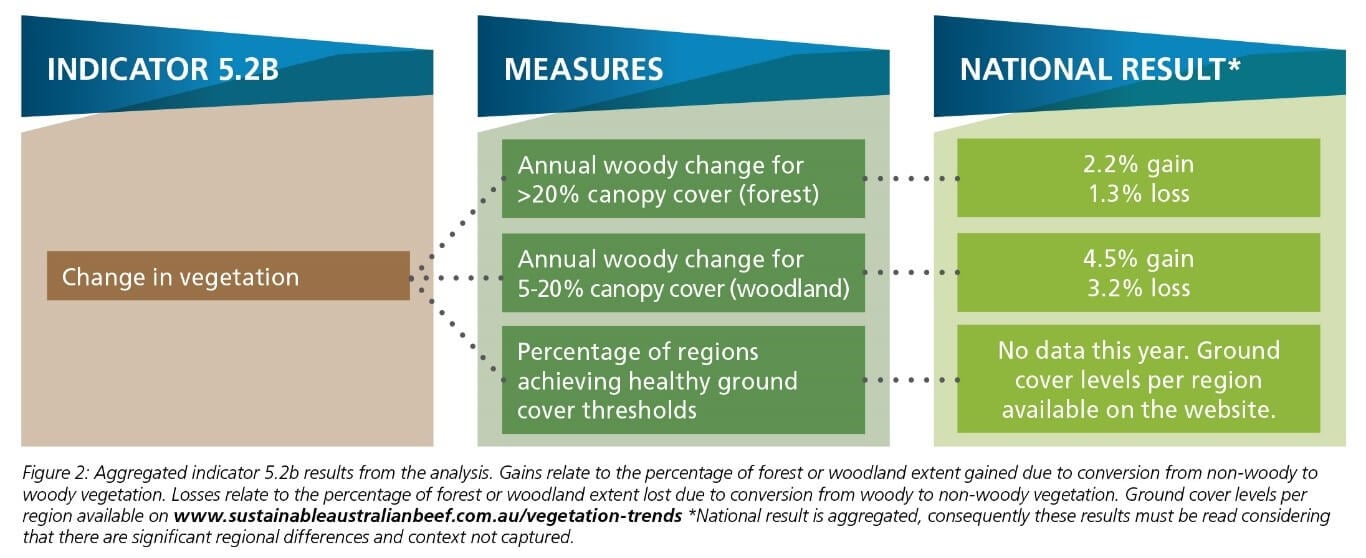
The balance of tree and grass cover indicators
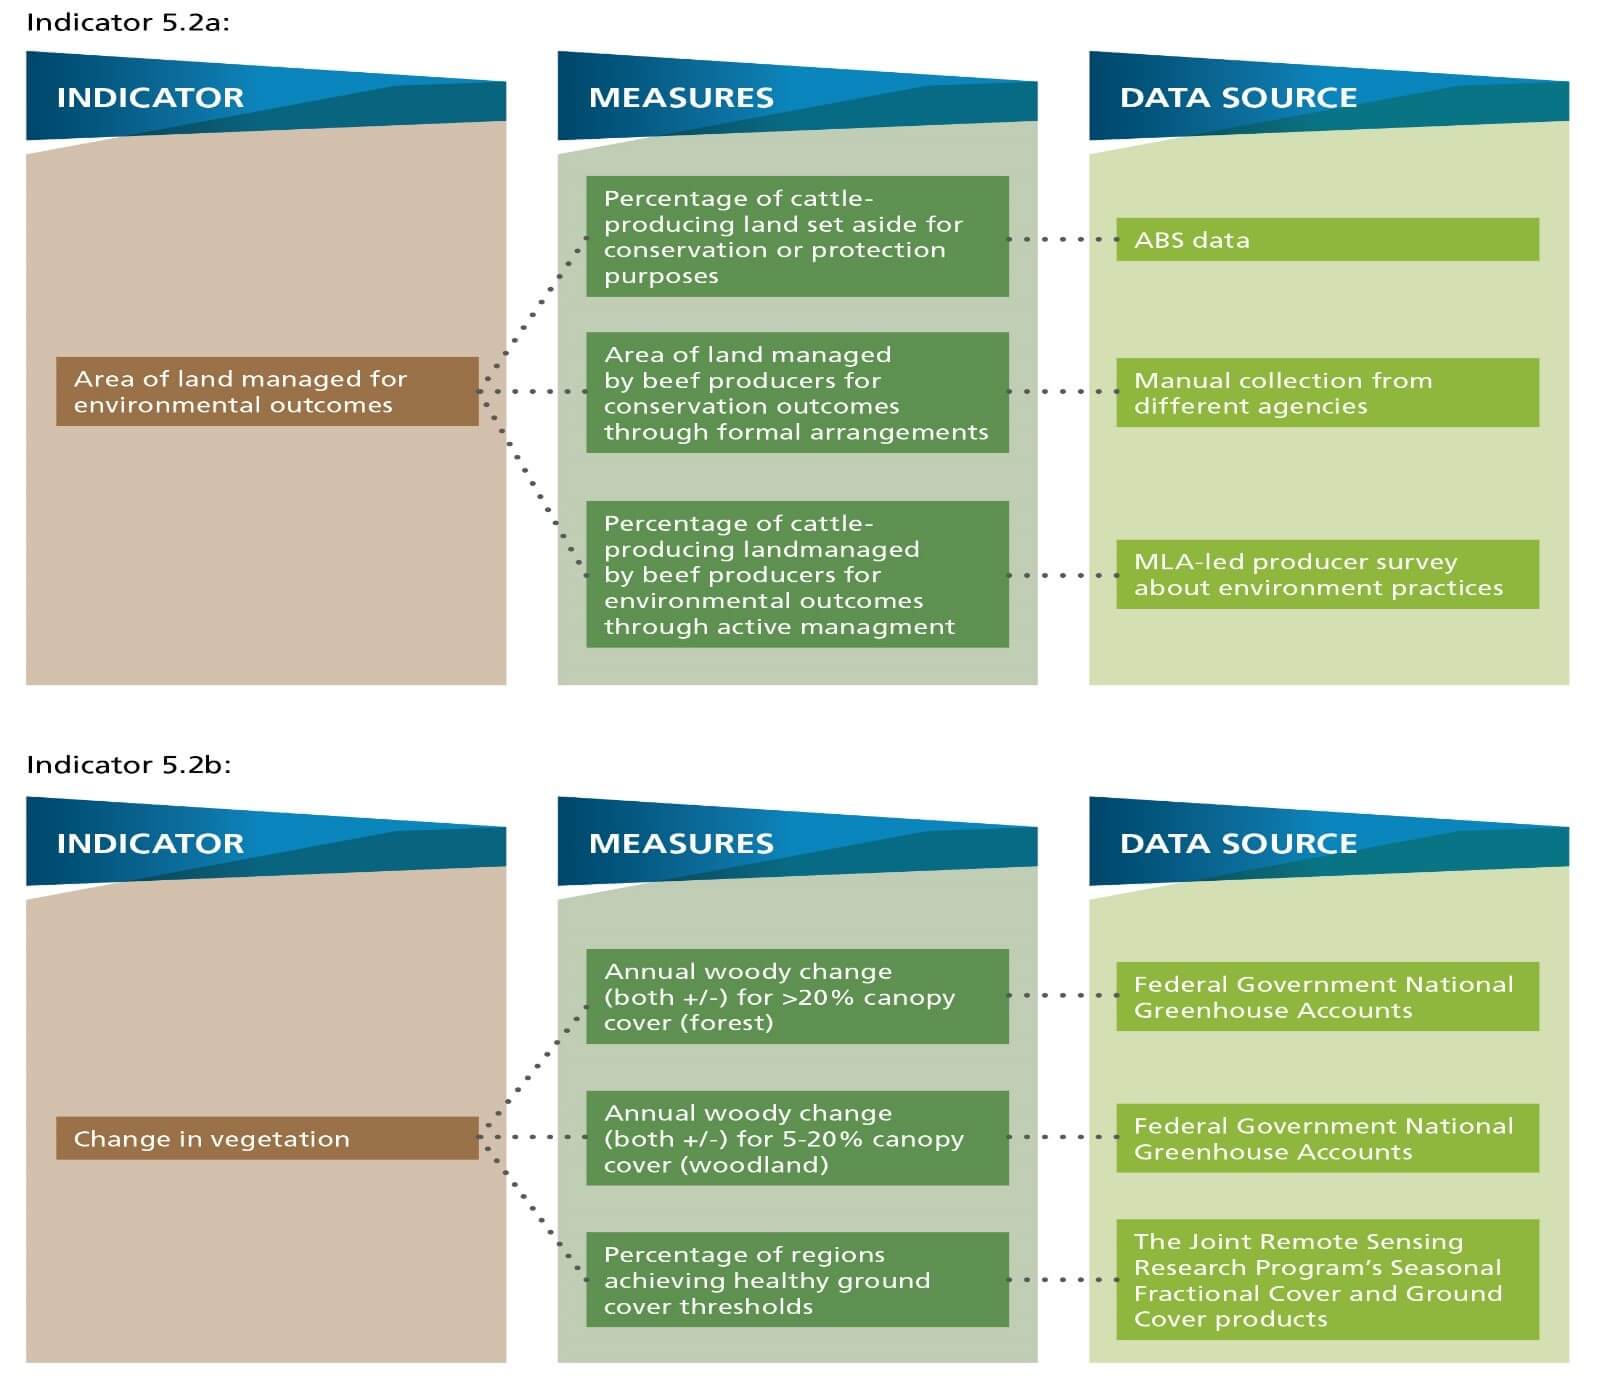
Measuring change in vegetation across Australia
The challenges of measuring indicator 5.2b
Advances in satellite technologies are enabling every property in Australia to be imaged on a weekly basis, and over three decades of satellite imagery is readily available. The Framework is capitalising on these developments through collaboration with government agencies and private sector companies at the forefront of the technology. The aim is to ensure every producer has equal access to key data being compiled by government agencies on their properties; access to the latest publicly available satellite data, and the tools to bring the information together to support on-ground and strategic management decisions for individual producers and the broader industry.
In developing the balance of tree and grass cover measures we have been guided by aimed at delivering an operational platform that is practical, credible, regionally relevant and contextual.
The solution - how the methodology developed
Leveraging existing data sets
State and federal agencies have been analysing earth observation satellite data across the continent to monitor vegetation and land use change since about 1990. Government and science organisations have been able to use this information for regulatory, planning, policy development, international reporting and research. However it has been difficult, if not impossible, for most individual producers to access and use this information.
In investigating practical and credible solutions to this challenge, the expert panel looked at existing programs, data and methodologies. The expert panel advised that several government and research programs are monitoring vegetation change using remote sensing at state and national levels to meet a range of needs, however, no single program met the full requirements of the Framework.
Given the objectives and benefits of a nationally consistent approach, it was agreed that two primary data streams were best suited to report against the agreed Framework indicators.
These were:
- The National Greenhouse Accounts National Forest and Sparse Woody Vegetation data
- The Joint Remote Sensing Research Program (JRSRP) Seasonal Fractional Cover and Ground Cover products available through TERN AusCover
To fully utilise existing information, and to meet our objectives on behalf of the industry, Cibo Labs was engaged to put a new analytic framework in place. This involved the development of a data analysis environment to:
- Integrate 30 years of satellite data identifying trends in woody vegetation and ground cover. Around 12 billion individual satellite pixels across the continent were analysed for each time period, requiring high-performance computing resources and contemporary data science techniques.
- Analyse trends specifically relating to grazing regions and the continent
- Analyse trends for every rural grazing property
- Enable the seamless aggregation of data for on-going reporting in relation to Natural Resource Management (NRM) regions, Local Government, ABS and ABARES farm surveys, ecological regions, and project-specific reporting.
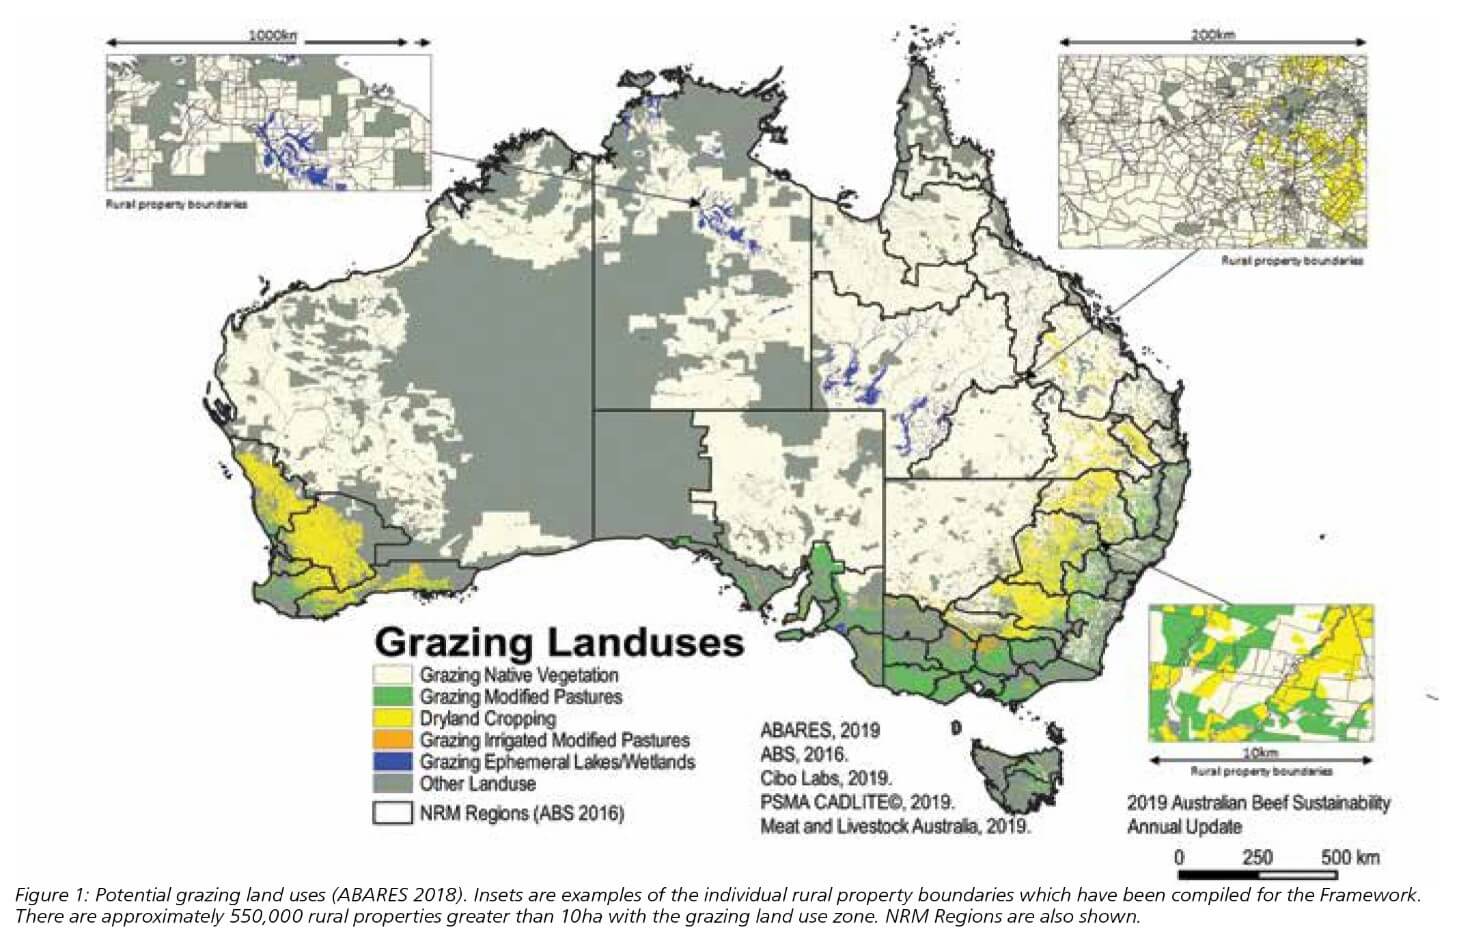
Where are Australia’s beef producers?
National statistics produced by the Australian Bureau of Statistics suggest there are 47,000 farms producing beef. This information doesn’t provide detail on exactly where these farms are located for the purposes of analysing trends in vegetation and production to isolate the data for beef enterprises.
At the present time, Australian governments and industry have several mechanisms for collecting information on land use, and the ABS and ABARES Farm Surveys, however, these processes do not allow the specific commodities being produced by rural holdings to be identified. For the first national analysis we have therefore relied on the 2018 national land use dataset provided by ABARES on a 50m grid.
The map below provides an overview of the location of specific land uses where beef cattle grazing may occur covering an area of about 5.5 million km2 or 70% of the continent.
To overcome many of the limitations of existing national reporting systems, the ABSF has developed a new rural properties database. This was developed for MLA in partnership with Cibo Labs and PSMA Australia (See Figure 1 below). PSMA’s CadLite dataset provides a spatial representation of millions of legal land parcels across Australia. CadLite draws on state and territory data to provide a seamless national database of cadastral boundaries, excluding easements and road drainage easements, and identifies the relationships that exist between a property and a cadastral parcel.
Using the national land use data in combination with the CadLite data we have identified some 550,000 individual rural freehold and leasehold properties greater than 10ha which may have grazing (see insets in Figure 1.). Critically, these property boundaries are based on publicly accessible information, but do not hold any personal or business information.
The information presented here has been compiled for every rural property over 10ha in Australia, while preserving individual property privacy. This approach has the potential to be strengthened, enabling landholders to opt-in for the dual benefit of making on-farm decisions and to demonstrate environmental performance.
The results - national trends in tree and grass
Through the work of Cibo Labs and advice of the expert panel, the Framework now has a national measure of vegetation change spanning 30 years across every rural property (greater than 10ha) and all 56 NRM regions for the beef industry – the first time this has been done in Australia. All regions can be viewed through tree and grass cover dashboard.
The results of the remote sensing analysis shows the complexity of change in space and time across Australia’s vast landscape. Changes need to be understood in the context of factors like drought, fire, ecosystems and the variety of human activities. Vegetation changes mean very different things in different areas. While there is a need to report at a national level for the Framework, readers should note that the story of change is so complex that summarising it into one number cannot capture the full meaning of that change and carries risk in losing the important regional context.
These new balance of tree and grass cover measures:
- Allow the Framework to annually track and measure the impact the beef industry is having on vegetation across the nation
- Support the industry to drive improvement in environmental practices and celebrate good
- farm management
- Provide a tool for producers to use for improving on-farm productivity and land management
- Create a science-based measure of vegetation, separating fact from fiction in ongoing debates and for policymakers.
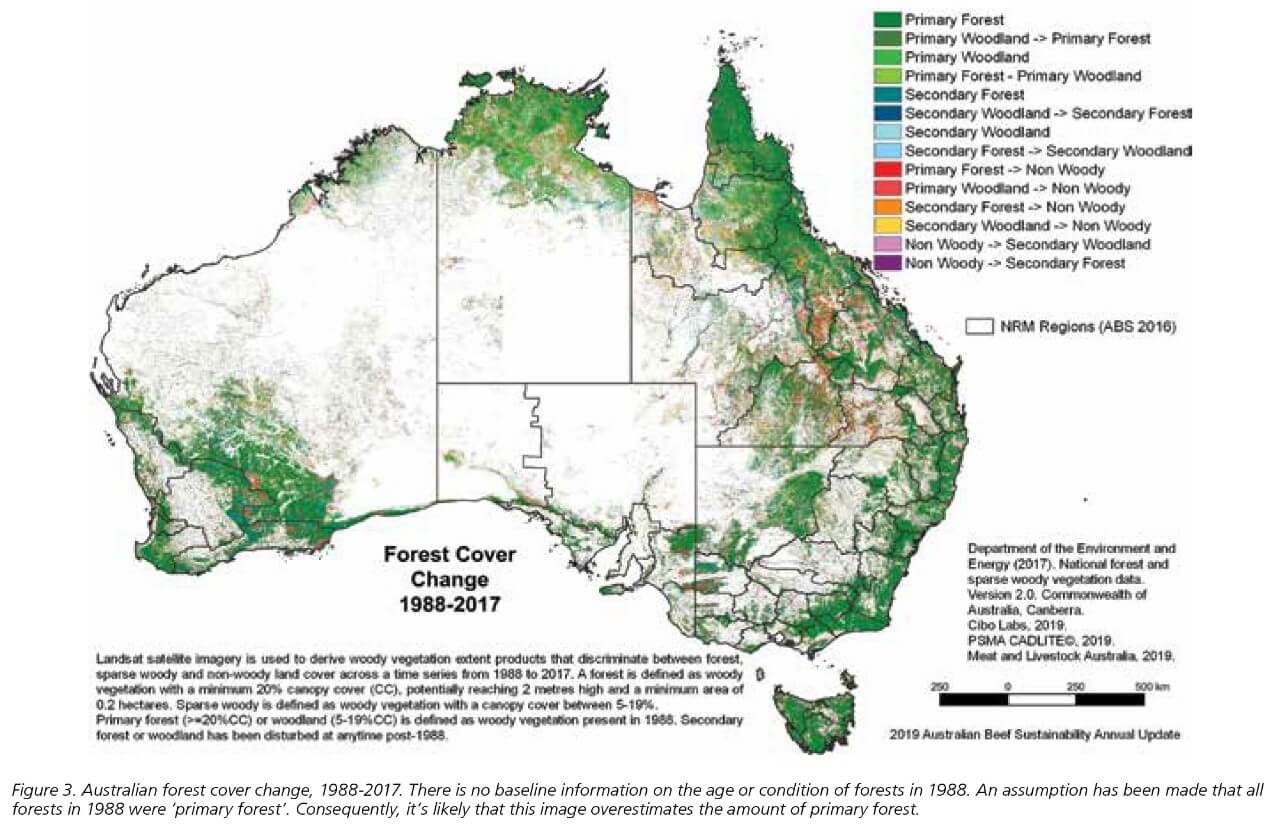
What the data is telling us presents the overall trends in forests and woodlands. At the national level the area of forest and woodlands is increasing, and the conversion (removal) of primary forest to other land uses has declined by more than 90 percent from 1990 levels. In net terms, clearing of primary forest (pre 1988) has declined significantly and forests are regenerating at a greater rate than clearing of secondary forests is occurring. Regionally, the majority of vegetation management is associated with clearing of regrowth, managing fire and fence lines and for fodder harvesting during periods of drought.
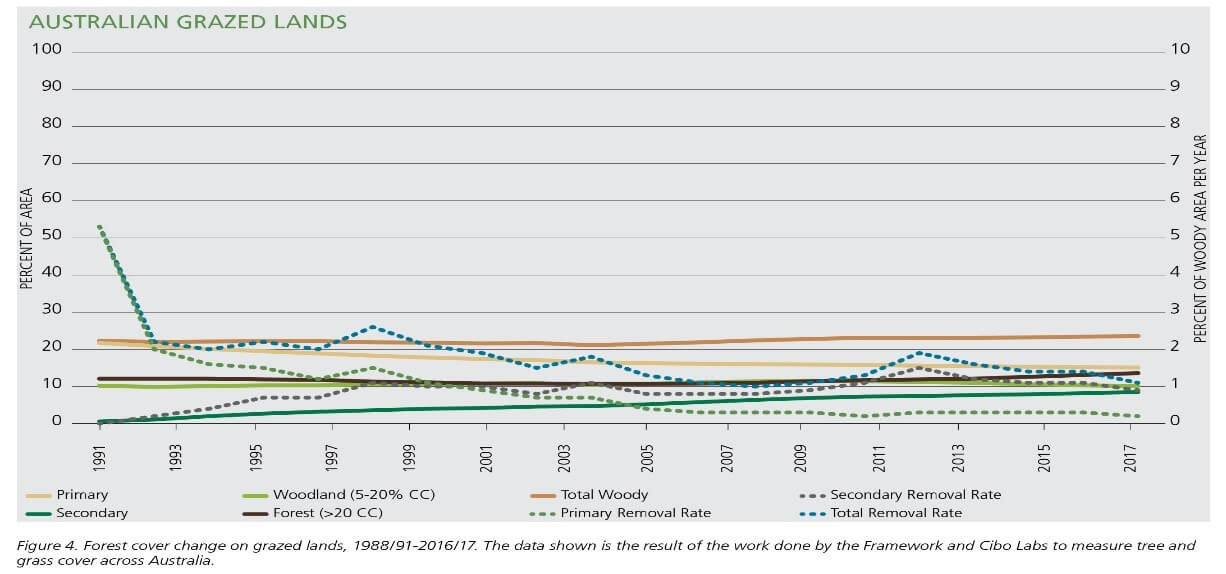
Overall Australia’s grazed agricultural lands are increasing in woody vegetation cover in terms of both extent and density at a greater rate than clearing of secondary forests. Over the past five years, those regions identified to have removed more than 5% of primary forest (1% per year) can largely be attributed to forestry harvesting (pre-1988 plantings on private land) in the southern regions and cyclones and fire damage in the northern regions. Further work is required to separate natural disturbance from clearing events.
Using the information compiled for the ABSF, producers are able to compare their tree cover and ground cover levels to relevant regional benchmarks aimed at increasing cover in erosion prone landscapes and improving both soil health and productivity.
There have been small areas of woody vegetation cleared across larger groups of properties for reasons such as managing regrowth, managing fire and fence lines, and for fodder harvesting in periods of drought. As technology improves enabling federal vegetation reporting, the Framework aims to report clearing for different purposes.